Performance
This page covers where a GKX run spends its time on one device, how to profile it, and the tracked profiler artifacts that back each number. Multi-device and multi-worker evidence – independent scans, ensembles, sharded nonlinear routes and their identity gates – is in Parallelization policy.
JAX performance model
GKX uses JAX to compile array kernels ahead of time, enabling
vectorized, accelerator-ready performance while retaining automatic
differentiation. The linear operator and time integrator are designed to be
jit-friendly and to avoid Python-side loops in performance-critical paths.
The linear solver precomputes geometry-dependent arrays (gyroaverage
coefficients, drift components, mirror term, and zero-mode masks) in a
LinearCache so they are not recomputed at each time step. The cache also
stores the Laguerre/Hermite index arrays and their derived coefficients
(l+1, m+1, sqrt(m), sqrt(m+1)), which the mirror, curvature and
implicit-preconditioner terms reuse instead of rebuilding them on every RHS
call. The cache is reused inside the compiled integrator.
The linear integrator is jit-compiled with the number of steps and method
as static arguments. The operator term switches
(gkx.operators.linear.params.LinearTerms) should remain static inside
a compiled loop to avoid recompilation, and the cached operator arrays can be
built once and reused across runs. Nonlinear IMEX paths reuse the
electrostatic compiled linear-RHS route whenever apar = bpar = 0.
benchmarks/references/gkx_2_representative_performance_refresh.json is the
compact representative refresh. It admits two bounded local-CPU rows after
finite CPU/GPU numerical checks; its office-GPU timings are kept as rejected
provenance because both A4000s were already fully loaded, so they do not update
the published speed claim.
Explicit-step kernels
The mirror, curvature and grad-B terms shift H by up to two Hermite and one
Laguerre index. XLA lowers every shifted view as its own sweep of the state; at
64x64x24, (Nl, Nm) = (4, 8) in float32 the Laguerre stride is 6 MB
against a 4 MB L2 on an RTX A4000, so each view costs a DRAM pass. Those fused
RHS kernels ran at 14–60 GB/s of a 448 GB/s peak and were 55 per cent of the
explicit step. gkx.terms.linear_terms.fused_drift reads each
(l, m) neighbourhood once per tile in a Pallas (Triton) kernel on real and
imaginary planes, the form Triton accepts: 0.15 ms for the three terms against
2.2 ms, at round-off agreement with the jnp terms (1.8e-7 relative in
float32, 1.7e-16 in float64). It runs on NVIDIA GPUs when
Nx*Nz >= 64 and Nl*Nm <= 256; CPU, other GPUs, Hermite-sharded slabs and
the per-term diagnostics keep the jnp terms, which are also what forward-
and reverse-mode derivatives go through.
Two smaller changes apply on every backend. The jnp terms slice one padded
copy of H instead of padding per shift, which on XLA:CPU removes the
recomputation of H in each view (bitwise identical). The Nyquist fix of the
linked streaming output touches the two self-conjugate rows rather than
reducing over the whole state (bitwise identical; the stacked streaming and
hypercollision transform at (8, 16) went from 5.6 to 3.6 ms on GPU). It is
a concatenate on GPU and an in-place scatter on CPU, where XLA turns the
concatenate into a copy fusion twice as slow as the whole-state version. On XLA:CPU the
linked output is also materialized before the conjugate restore, which
otherwise fuses the gather into the restore and recomputes it; on GPU that
barrier costs 30 per cent and is not applied.
Running on CPU
A shipped default deck at 96x96x48 takes roughly 1.1–1.6 hours on an Apple
M3 Max (10 performance + 4 efficiency cores, JAX CPU, float32), and about 97
per cent of that is time stepping. Geometry construction, compilation,
plotting, and I/O are seconds each and are not worth optimizing against the
stepping cost.
An XLA profile on a 36-core office CPU (jax 0.9.2) at 32x32x16,
64x64x24 and 96x96x48 measured 196 ns per Nx*Ny*Nz*Nl*Nm
element per step, flat across the two larger grids and so converged rather
than a small-grid artifact. The same profile splits the step as follows:
about 60 per cent is data movement and about 39 per cent is the FFTs themselves. Physics arithmetic is not separately measurable: XLA fuses it into the movement and FFT kernels, and the 0.8 per cent that appears as arithmetic is only the residue that failed to fuse;
there is no dealias zero-padding. The 2/3 rule is a mask multiply, and the only two
padoperations in the step come fromjnp.fft’ss=argument and have zero width;four
copy_concatenate_fusionkernels rooted at thejnp.concatenatein_complete_hermitian_ky(operators/nonlinear/brackets.py) account for 41.9 per cent of step time, running four times per RK3 step. One of them costs 6.9 ms against 2.8 ms for a same-sized FFT while doing strictly less arithmetic, and they carryouter_dimension_partitions:["1","2","3"], so XLA threads them three ways regardless of core count.
That completion exists because the evolved state stores the two-sided ky
axis. Completing once per step instead of once per RHS is bitwise identical but
makes XLA:CPU materialize 2.3–2.7 times more bytes on the runtime route, so
what removes the concatenate is the state layout. The layout rule is written
down and tested as the ky layout contract (gkx.core_ky_layout, see
Numerics), and the half-spectrum layout is the runtime default.
On a linked Cyclone deck (XLA:CPU, jax 0.10.2) lowering onto the half
layout removes the completion entirely – the reverse count goes to zero –
and cuts the bytes owned by materialized copy/concatenate buffers by
73.5 per cent (rk3) and 71.4 per cent (rk4) on the RK step at 32x32x24 and
by 72.4 and 70.3 per cent at 64x64x24, against a state that is only 46.9 per
cent smaller. Those are byte counts from the compiled module, not wall-clock.
The runtime now builds the half grid by default; ky_layout = "full" keeps
the two-sided state and its completion.
The supported CPU mode is ordinary serial execution with XLA threading its own
kernels; [parallel] strategy = "serial" is the default. XLA uses only about
3 of 14 cores during stepping on the M3 Max, because the dominant copy kernels
do not parallelize; that headroom is a limitation of the current kernel mix
rather than a configuration mistake. The compiled module says why: XLA gives
nearly every fusion at most four tasks (outer_dimension_partitions in its
backend config; two for most of the RHS fusions at 32x32x24), however many
threads exist, and 40–50 per cent of the ops are not partitioned at all. A float32
RK3 step at 64x64x24, (4, 8) on a shared 36-thread Xeon (load 12–17),
in ms for 1, 4, 8 and 16 threads, was 1357, 1294, 1193, 1229 before the changes
above and 660, 539, 526, 527 after; at 32x32x24 it was 303, 306, 273, 276
and 125, 121, 138, 109. The code is twice as fast at every thread count, but
neither version scales past four threads.
Do not set
XLA_FLAGS=--xla_force_host_platform_device_count=N for a production CPU run:
it splits one thread pool into N virtual devices, and a serial run measured
34 per cent slower with it. Forced CPU devices are for identity testing of the
sharded routes in Parallelization policy, not for speed; pmap or
shard_map of the linear RHS over two or more of them segfaulted XLA:CPU’s
compiler on jax 0.11.2, and the nonlinear state_sharding route gathers
the state each step, so it does not divide the work either.
Persistent compilation cache
A GKX run is compile-dominated at the sizes people iterate on: on one office
GPU a 100-step nonlinear case spends about 22.9 s of a 25 s integrator wall in
XLA compilation, and on a laptop CPU the same compile costs about 14 s. The
executable therefore enables JAX’s persistent compilation cache by default, in
.cache/gkx/jax beside the source tree (~/.cache/gkx/jax when the
installed package tree is read-only), namespaced by the installed JAX version
so a toolchain upgrade starts a new directory rather than reading executables
built by a different compiler. The cache key is XLA’s, over the lowered HLO, the
compilation options and the target device, so a changed grid, changed physics,
or a different backend is a miss rather than a stale hit.
A 16x16x32 nonlinear step compiles about 320 separate kernels. The fused
scan is 2.1 s of a 13.5 s compile and the rest are about 20 ms apiece, which
is why GKX overrides JAX’s default of persisting only compiles slower than one
second: keeping that default saves 3.9 s of the 13.5 s, while dropping the
threshold to zero saves 12.6 s. The directory grows by about 1.6 MB per
distinct problem shape and has no size cap.
Two environment variables are the escape: GKX_JAX_CACHE=0 disables the
cache, and GKX_JAX_CACHE_DIR relocates it (useful on a cluster where the
source tree is read-only). Clearing the cache is rm -rf on the directory;
nothing is lost but the next cold compile. A cold end-to-end timing needs
GKX_JAX_CACHE=0 or an empty cache directory.
Warm-started scans
The compilation cache reuses the executable between runs. Warm start
([output] warm_start, --warm-start) is its state-side counterpart: it
reuses the answer, seeding each point of a repeated workload from the
converged state of its neighbour. A ky scan is walked in monotone ky order so
that neighbours follow neighbours, and results are written back into the
requested order. See Input Files and Executable for the controls.
It is opt-in, for two measured reasons recorded in
gkx.workflows.runtime.warm_start:
on the certified adaptive eigensolver it is correctness-neutral (cold and warm agree to about
1e-6relative on the Cyclone deck, well inside the certified residual) but also cost-neutral. That solver’s work is a fixed-size filtered Arnoldi whose cost is set by the Krylov dimension and the filter length, not by the starting vector, and it already converges in one restart from the analytic seed;on a fixed-horizon time integration a warm seed reaches the horizon-converged growth rate in half the horizon, but at any horizon short of convergence it reports a different number than a cold start, because it has removed a startup transient the cold run still contains. GKX’s parity decks are pinned to reproduce that transient, so switching warm start on for everyone would silently move published numbers.
Switch it on deliberately, on a horizon you have checked, and record it: a
warm-started scan writes its visit order and warm/cold point counts into the
warm_start block of its summary artifact. An eigensolver started inside one
branch can also converge to that branch, so scan a case whose branch structure
is unknown once cold before trusting the warm numbers. Compare scan variants
only with the compilation cache already populated for both, or the first one
pays compilations the second reuses.
Profiling tools
No speedup claim should be made from a local profile, scaling panel, or parallelization artifact unless the matching numerical-identity gate and hardware-specific profiler artifact are cited together.
Nonlinear end-to-end profile
The Cyclone profiling driver supports Perfetto traces, XLA HLO dumps, and memory snapshots:
python scripts/profiling/profile_runtime_kernels.py cyclone \
  --trace-dir tools_out/gkx_nl_trace \
  --xla-dump-dir tools_out/gkx_nl_xla \
  --steps 400 --dt 0.0377 --Nl 4 --Nm 8
It blocks every returned JAX leaf before stopping its timer and accepts
--repeats. For repeated Python calls with fixed geometry and model policy,
add --reuse-prepared-simulation and an explicit --steps; the ordinary
command is the executable-style end-to-end startup profile, the prepared mode
measures compile-once repeated-call throughput.
JAX writes the trace under
<trace-dir>/plugins/profile/<timestamp>/*.trace.json.gz with the matching
*.xplane.pb metadata, and the directory opens in Perfetto or XProf; the
optional memory.prof snapshot can be inspected with pprof or XProf’s
memory tooling. For GPU profiling set JAX_PLATFORM_NAME=gpu. JAX GPU runs
preallocate most device memory; when diagnosing an out-of-memory failure on a
shared machine use XLA_PYTHON_CLIENT_PREALLOCATE=false or a reduced
XLA_PYTHON_CLIENT_MEM_FRACTION, and do not let those debugging knobs change
a published benchmark contract.
The nonlinear benchmark harness records per-step runtime and end-of-run scalar diagnostics through the compact diagnostics path, without materializing mode-resolved histories:
# retired generator; restore it first: git show f005418bf575:scripts/benchmarks/benchmark_nonlinear_suite.py > scripts/benchmarks/benchmark_nonlinear_suite.py
python scripts/benchmarks/benchmark_nonlinear_suite.py --steps 200 --dt 0.0377 \
  --out tools_out/gkx_nl_bench.csv
python scripts/benchmarks/benchmark_nonlinear_suite.py --laguerre-mode spectral
python scripts/benchmarks/benchmark_nonlinear_suite.py --gx-log reference_run.out
The last form compares runtime per step against a reference-code log.
Startup and cache construction
The startup profiler breaks the cold path into runtime config load, geometry resolution, grid construction, parameter and term setup, initial condition, linear-cache construction, and the first compile+execute of the field solve, the linear and full RHS, and the nonlinear integrator:
python scripts/profiling/profile_startup_and_cache.py runtime-startup \
  --config examples/03_nonlinear_tokamak/case_full.toml \
  --ky 0.3 --Nl 4 --Nm 8 --compile-steps 1 \
  --json-out tools_out/startup_cyclone.json \
  --csv-out tools_out/startup_cyclone.csv

python scripts/profiling/profile_startup_and_cache.py linear-cache \
  --config examples/03_nonlinear_tokamak/case_full.toml \
  --Nl 4 --Nm 8 \
  --json-out tools_out/linear_cache_cyclone.json \
  --csv-out tools_out/linear_cache_cyclone.csv
The linear-cache mode decomposes build_linear_cache() into geometry
loading, spectral-grid construction, gyroaverages, Laguerre transforms, drift
coefficients, damping factors, and final assembly. Both modes accept
--trace-dir and --memory-profile for phase-annotated XProf/Perfetto
traces, and --debug-log-cache / --explain-cache-misses when a repeated
compile looks suspicious. Traces start with python_tracer_level=0 and
host_tracer_level=0, which avoids the optional TensorFlow Python-hook
import. On the shipped short nonlinear decks the first nonlinear integrator
compile is the largest cold-start phase, ahead of build_linear_cache.
Fixed-step linear integrator
python scripts/benchmarks/benchmark_integrators.py \
  --method sspx3 --steps 480 --dt 0.005 \
  --Nl 7 --Nm 14 --ky 0.3 --warmup 1 --repeat 5 \
  --out-json tools_out/linear_sspx3_profile.json
docs/_static/linear_sspx3_stage_profile.json compares the same Cyclone
trajectory before and after explicit-stage consolidation: state and
field-history norms agree exactly, and the median CPU times of 3.202 s and
3.223 s differ by 0.7 per cent, below the 3 per cent reporting threshold and of
the wrong sign for a speedup. XLA had already removed the unused SSPX3 stage
from the compiled graph.
Tracked kernel profiles
These are single-state, post-compilation kernel timings, used to localize hot paths. None of them is an end-to-end runtime claim.
Nonlinear RHS split (Cyclone)
python scripts/profiling/profile_runtime_kernels.py nonlinear-step-split \
  --config benchmarks/cases/cyclone_nonlinear_short.toml \
  --repeats 10 \
  --out docs/_static/nonlinear_rhs_profile_gpu.csv
# retired generator; restore it first: git show f005418bf575:scripts/artifacts/plot_scaling_panels.py > scripts/artifacts/plot_scaling_panels.py
python scripts/artifacts/plot_scaling_panels.py rhs-profile \
  --out docs/_static/nonlinear_rhs_profile.png
docs/_static/nonlinear_rhs_profile.json records the field solve, nonlinear
bracket, linear RHS, and full RHS on CPU and on one RTX A4000, for the default
grid-quadrature bracket and the optional spectral one:
Backend, bracket |
field solve |
nonlinear bracket |
linear RHS |
full RHS |
|---|---|---|---|---|
GPU, grid |
4.65e-4 s |
3.36e-3 s |
6.13e-3 s |
9.66e-3 s |
GPU, spectral |
2.41e-4 s |
1.50e-3 s |
6.20e-3 s |
6.38e-3 s |
CPU, grid |
3.55e-4 s |
3.67e-2 s |
4.12e-2 s |
1.01e-1 s |
CPU, spectral |
3.54e-4 s |
2.37e-2 s |
4.07e-2 s |
7.73e-2 s |
The spectral bracket is 1.54x (CPU) and 2.24x (GPU) faster than the grid
bracket and the full RHS 1.30x and 1.51x, which is why it is an opt-in
mode behind the case-level parity gate below rather than a default. The
compiled linear RHS is the largest single cost in the warm step on this case.
Benchmark-size Cyclone Miller RHS
The shipped nonlinear Miller input at Nx=192, Ny=64, Nz=24,
Nl=4, Nm=8 exposes a different balance:
python scripts/profiling/profile_runtime_kernels.py nonlinear-step-split \
  --config benchmarks/cases/cyclone_nonlinear_miller.toml \
  --repeats 5 \
  --out docs/_static/nonlinear_rhs_profile_miller_cpu.csv
docs/_static/nonlinear_rhs_profile_miller.json records CPU full-RHS times
of 3.48e-1 s (grid) and 2.20e-1 s (spectral), with
linear_rhs=1.24e-1 s and nonlinear_bracket=9.89e-2 s in grid mode. On
one RTX A4000 the full RHS is 1.28e-2 s (grid) and 1.48e-2 s
(spectral): the spectral bracket is 1.63x faster, but the full GPU RHS is
faster in grid mode.
The fused full nonlinear-RHS trace on the same input is generated with:
python scripts/profiling/profile_runtime_kernels.py full-nonlinear-rhs \
  --config benchmarks/cases/cyclone_nonlinear_miller.toml \
  --ky 0.3 --Nl 4 --Nm 8 --repeats 5 \
  --summary-json docs/_static/full_nonlinear_rhs_trace_summary.json
The CPU artifact reports warm_seconds=3.35e-1 and 3343 HLO lines; the
one-RTX-A4000 artifact docs/_static/full_nonlinear_rhs_trace_gpu_summary.json
reports warm_seconds=1.28e-2 and 3336 HLO lines, with an HLO token triage
dominated by broadcasts (1822), reshapes (1545), multiplies (871), FFTs (229),
slices (215) and reductions (132). That points nonlinear work at fused layout
and bracket data movement.
Stellarator runtime-mode RHS
docs/_static/nonlinear_rhs_profile_stellarator_runtime.json profiles W7-X
and HSX at their adiabatic-electron nonlinear runtime mode (Nx=96,
Ny=96, Nz=48, Nl=4, Nm=8, k_y=1/21) to check that the
grid-Laguerre path and VMEC/EIK geometry inputs keep a consistent hot-path
balance on non-axisymmetric cases. W7-X full-RHS times are 3.09e-1 s (CPU)
and 2.73e-2 s (GPU); HSX 3.09e-1 s and 2.71e-2 s. On the GPU the
nonlinear bracket is about 59–60 per cent of the full RHS and the linear RHS
about 42 per cent.
Linear RHS terms
The term profiler times each compiled linear contribution used inside nonlinear runs:
# retired generator; restore it first: git show f005418bf575:scripts/profiling/profile_linear_rhs_terms.py > scripts/profiling/profile_linear_rhs_terms.py
python scripts/profiling/profile_linear_rhs_terms.py \
  --config examples/03_nonlinear_tokamak/case_full.toml \
  --ky 0.3 --Nl 4 --Nm 8 --repeats 8 \
  --out docs/_static/linear_rhs_terms_profile_cpu.csv \
  --summary-json docs/_static/linear_rhs_terms_profile.json
The full linear RHS is several times the sum of its independently timed terms,
because the full path recomputes the field solve, H assembly and every
weighted contribution as one graph; the gap is a localization signal, not a
speedup claim.
Artifact ( |
full linear RHS |
sum of terms |
largest terms |
|---|---|---|---|
|
1.08e-1 s |
1.68e-2 s |
hypercollisions, linked |
|
1.27e-1 s |
1.87e-2 s |
streaming 2.74e-3 s; linked |
|
2.93e-1 s |
4.83e-2 s |
streaming 7.33e-3 s, linked |
|
5.50e-3 s |
3.41e-3 s |
hypercollisions 4.7e-4 s, streaming 4.2e-4 s |
|
5.48e-3 s |
3.73e-3 s |
mirror 6.0e-4 s, hypercollisions 4.7e-4 s; linked |
On the initial state the hypercollision and linked |k_z| norms are zero; the
z_wave companions activate them (matched norms 2.35e-4) and are the ones
to use for linked-|k_z| decisions. The state-window gate protects the
zero-collision fast path:
# retired generator; restore it first: git show f005418bf575:scripts/artifacts/generate_linear_rhs_parallel_gates.py > scripts/artifacts/generate_linear_rhs_parallel_gates.py
python scripts/artifacts/generate_linear_rhs_parallel_gates.py zero-norm-state-window \
  --config examples/03_nonlinear_tokamak/case_full.toml \
  --ky 0.3 --Nl 4 --Nm 8 \
  --out-json docs/_static/linear_rhs_zero_norm_state_window_gate.json
It accepts skipping collisions for this nu = 0 Cyclone window and rejects
skipping hypercollisions, whose relative skip error is zero on the initial state
but 3.59e-3 on the resolved z-varying state.
Full fused linear RHS
The companion full-graph profiler lowers and times the production
linear_rhs_cached entry point for a runtime TOML:
python scripts/profiling/profile_runtime_kernels.py full-linear-rhs \
  --config benchmarks/cases/cyclone_nonlinear_miller.toml \
  --ky 0.3 --Nl 4 --Nm 8 --repeats 3 \
  --summary-json docs/_static/full_linear_rhs_trace_summary.json
The CPU artifacts record warm_seconds=1.54e-1 (initial state) and
8.38e-2 (full_linear_rhs_trace_z_wave_summary.json), both with 2779 HLO
lines dominated by broadcasts (983), reshapes (578), reductions (316), FFTs
(312), multiplies (200) and gathers (51). The one-RTX-A4000 artifacts
full_linear_rhs_trace_gpu_summary.json and
full_linear_rhs_trace_gpu_z_wave_summary.json record 5.13e-3 s and
5.15e-3 s.
Repeated simulations and diagnostics cost
Repeated Python calls should prepare the simulation once rather than rebuild it for every objective or ensemble evaluation:
import gkx

case = gkx.load("examples/03_nonlinear_tokamak/case_full.toml")
simulation = gkx.prepare(case).warmup()
time, diagnostics, state, fields = simulation.solve()
# Same shape and dtype: the compiled scan is reused, not rebuilt.
time, diagnostics, state, fields = simulation.solve(initial_state=state)
warmup() forces the compile, so a later timed solve measures execution;
summary() reports the state shape, precision, devices, working set and
whether the persistent cache is on. A new initial_state of the same shape
and dtype reuses the compiled scan: tests/unit/nonlinear/test_nonlinear.py
counts exactly one trace over repeated calls. API Reference documents the
object; Nonlinear automatic differentiation covers the nonlinear derivative GKX supports.
The controlled prepared profiles
docs/_static/prepared_nonlinear_runtime_cpu_profile.json and
docs/_static/prepared_nonlinear_runtime_gpu_profile.json run the same
200-step adaptive RK3 trajectory of
examples/03_nonlinear_tokamak/case_full.toml (diagnostic
stride 10, compact scalar diagnostics) at commit b150705c with Python
3.12.13, JAX 0.10.2 and NumPy 2.5.2, on a laptop CPU and on one RTX A4000:
Quantity |
CPU |
GPU |
|---|---|---|
preparation, compile and first execution |
58.87 s |
13.52 s |
warm run, median of five |
55.33 s |
4.33 s |
peak host RSS |
1.807 GB |
1.846 GB |
peak device allocation |
not applicable |
417.1 MB |
That is a 12.8x device-throughput ratio after separate compilation, not an
end-to-end executable, transfer, or multi-GPU claim. The time vector is
identical on both devices, the potential, heat-flux and timestep norms agree
within 3.6e-6 relative, and the final-state norm differs by 4.4e-4 after
200 adaptive nonlinear steps, so that comparison is gated at 1e-3 rather
than the 1e-5 diagnostic gate.
The matched *_resolved_profile.json runs retain mode-resolved histories on
the same trajectory and reproduce the same recorded norms. They add 2.4 per
cent warm time and 4.0 per cent peak host RSS on CPU, and 0.8 per cent warm
time, 2.5 per cent peak device memory and 5.9 per cent peak host RSS on the
A4000, against an artifact gate of 25 per cent runtime and 10 per cent memory.
Compact diagnostics ([output] resolved_diagnostics = false) are therefore
the default choice for optimization and UQ loops, and resolved diagnostics are
cheap enough to enable when spectral evidence is needed.
Spectral nonlinear mode (gated fast toggle)
The spectral nonlinear mode skips Laguerre quadrature for the nonlinear bracket
(laguerre_nonlinear_mode = "spectral" or "fast"). It is not the default
because the speedup is case and backend dependent. The gate runs the same
bounded nonlinear case with grid-mode and spectral brackets and compares
end-of-run scalar diagnostics:
# retired generator; restore it first: git show f005418bf575:scripts/artifacts/gate_laguerre_nonlinear_modes.py > scripts/artifacts/gate_laguerre_nonlinear_modes.py
python scripts/artifacts/gate_laguerre_nonlinear_modes.py \
  --case cyclone --case kbm --case w7x --case hsx \
  --out-json docs/_static/laguerre_mode_gate.json \
  --out-csv docs/_static/laguerre_mode_gate.csv \
  --plot-out docs/_static/laguerre_mode_gate.png
A GPU artifact uses the same command with _gpu output names on the target
node. For W7-X and HSX, pass --w7x-geometry-file and --hsx-geometry-file
if the pre-generated *.eik.nc files live outside the default cache paths.
Artifact |
max relative scalar difference |
grid/spectral runtime: Cyclone, KBM, W7-X, HSX |
|---|---|---|
|
below |
|
|
below |
|
Every case passes parity, and HSX is slower in spectral mode on both backends, so the mode is a validated option, not a fast default. Production use should rerun the gate on the target case and backend before claiming a speedup, and long saturated-window gates for W7-X, HSX and KBM are still required before a transport claim.
Runtime and memory comparison
The publication runtime comparison uses a manifest-driven runner:
python scripts/benchmarks/benchmark_runtime_memory.py --list
python scripts/benchmarks/benchmark_runtime_memory.py --dry-run --case cyclone-linear --backend gkx_cpu
python scripts/benchmarks/benchmark_runtime_memory.py --continue-on-error --log-dir tools_out/runtime_memory_logs
The runner reads tools/runtime_memory_manifest.toml and writes
tools_out/runtime_memory_results.csv, tools_out/runtime_memory_summary.json,
per-row *.stdout.log / *.stderr.log files under the log directory, and
docs/_static/runtime_memory_benchmark.png. The reviewed summary CSV/JSON
and the panel are tracked and indexed from benchmarks/results/manifest.toml;
raw logs and NetCDF files stay in tools_out/.
The manifest holds three rows per case – gkx_cpu, gkx_gpu and gx
– and each row may carry a host, so one manifest drives local and remote
measurements while collecting wall time and peak RSS on the target machine. A
row may also carry a profile_command; when it prints warmup_time_s=...
and run_time_s=..., the runner merges those warm timings into the same
summary row as the cold pass.
The shipped panel covers Cyclone ITG linear and nonlinear, ETG linear, KBM
linear and nonlinear, W7-X linear and nonlinear, HSX linear and nonlinear, and
Cyclone Miller nonlinear. The stellarator rows use pre-generated *.eik.nc
geometry rather than live VMEC regeneration.
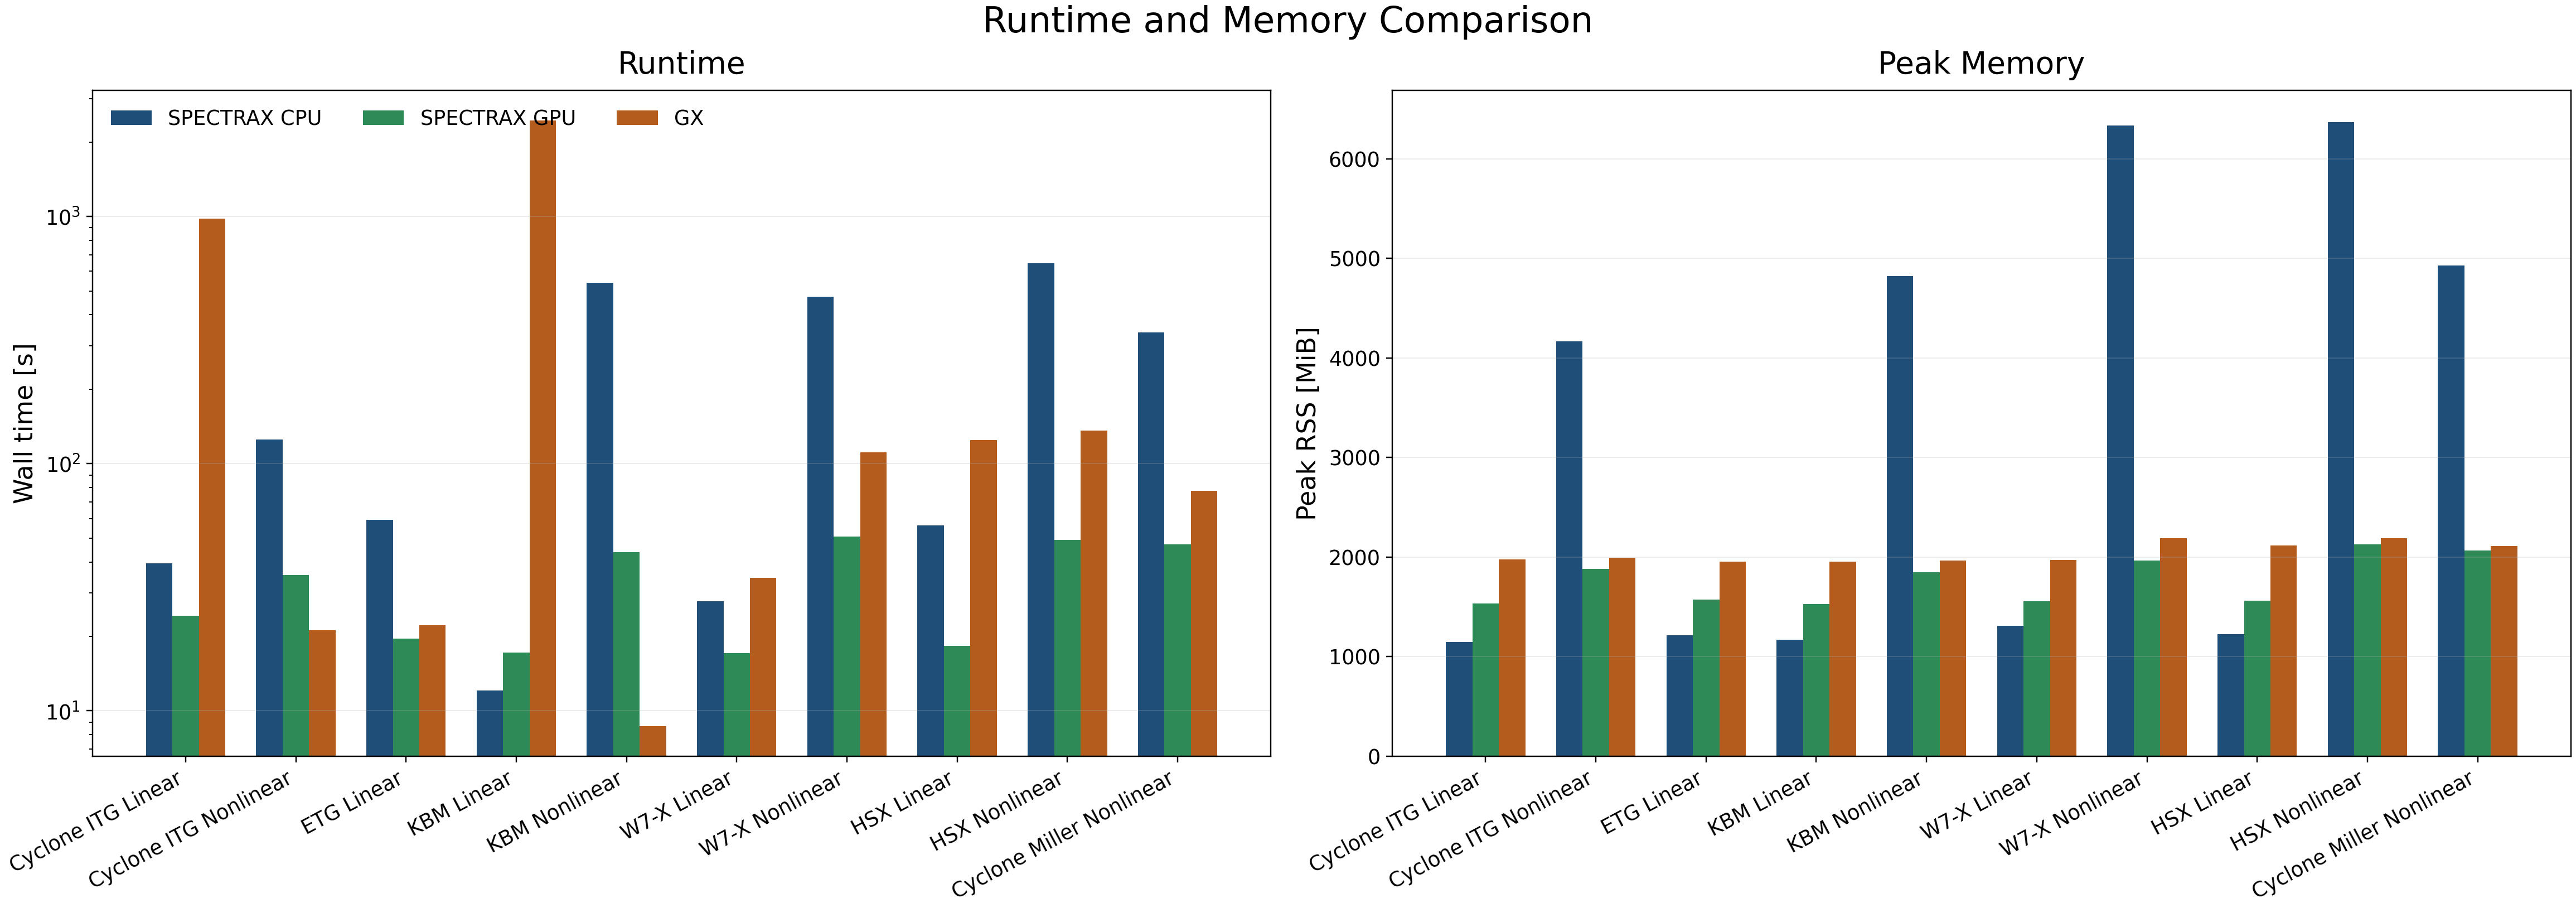
The runtime subplot uses a log scale because the wall times span roughly three orders of magnitude; the memory subplot stays linear because the peak-RSS spread is much narrower. The panel is regenerated from the tracked summary with:
python scripts/benchmarks/benchmark_runtime_memory.py \
  --summary-glob docs/_static/runtime_memory_summary_ship_refresh.json \
  --csv-out docs/_static/runtime_memory_results_ship_refresh.csv \
  --summary-out docs/_static/runtime_memory_summary_ship_refresh.json \
  --plot-out docs/_static/runtime_memory_benchmark.png
A PDF companion is emitted for manuscript workflows and is not tracked.
The panel reports cold wall time, which for the JAX backends includes
startup and compilation. That is the right number for “how long does one run
take” and the wrong one for “how fast is the kernel”, and it makes short
nonlinear cases look worse than their throughput: in
docs/_static/runtime_memory_results_ship_refresh.csv the GPU Cyclone
nonlinear row is 35.33 s against 21.15 s for GX, and KBM nonlinear 43.74 s
against 8.68 s. The runner overlays a warm second-run marker wherever a row has
run_time_s; the shipped summary has none, so the panel shows cold times
only. Warm throughput is what the prepared profiles above measure. For these
short lanes the useful work is compile and startup reduction and executable
reuse, which the persistent compilation cache addresses, rather than per-step
kernel work alone.
Preconditioner policies
Preconditioner choices, with shape, finite-value, linked-boundary and
shift-invert contracts covered by tests/unit/linear/test_linear.py and
tests/unit/linear/test_linear.py:
the implicit (backward-Euler GMRES) time integrator accepts
diag(damping plus the curvature/grad-B diagonal),damping,pas(the PAS streaming line solve with diagonal damping and drifts),pas-coarse(line plus a kx-coarse additive correction),hermite-line(the tridiagonal Hermite streaming solve at fixed \(k_z\)),hermite-line-coarse, andidentity;the shift-invert eigensolver accepts
hermite-lineandhermite-line-coarse,field-correctedandfield-corrected-coarse,pr3-cm,dampingandnone.pr3-cmruns three Peaceman–Rachford double sweeps of the Hermite line solve with the z-mean drift against an exact z-local drift/mirror/field block, solved by block-Thomas in the Laguerre index plus Sherman–Morrison. It certifies on the shipped Cyclone deck, but its cost is set by applying the preconditioner rather than by iteration count, and it is not cheaper than the defaultadaptiveeigensolver; Solvers gives the measured comparison and Numerics its structural preconditions.
Fresh runtime or iteration-count claims should be added through the tracked performance manifest and profiling tools, not through standalone probe scripts.
Parallel scaling
Parallel evidence lives in Parallelization policy; this section records only
the boundary it draws. Production parallelization starts with independent work
rather than nonlinear domain decomposition. gkx.ky_scan_batches and
gkx.batch_map split k_y scans and quasilinear/UQ ensembles while
preserving serial ordering, and the tracked large-run artifacts
independent_ky_scan_scaling_large.json and
quasilinear_uq_ensemble_scaling_large.json are the ones to cite. Sensitivity
sweeps are covered by the same ordering/provenance utilities, but need their own
scaling artifact before any speedup claim is promoted.
Whole-state nonlinear sharding is tracked in
nonlinear_sharding_strong_scaling_large.json and gated by
nonlinear_sharding_production_speedup_gate.json; its timing ratios are
profiler evidence and not a production nonlinear speedup claim. The
velocity-space linear-slice regime map is
linear_rhs_parallel_slices_sweep.json. The earlier two-device linear scaling
data in docs/_static/scaling_speedup_data.csv was measured on a Diffrax
linear route GKX no longer ships; it is a historical record, replotted with
python scripts/artifacts/plot_scaling_panels.py legacy-two-device (retired; Retired generators), not a
reproducible artifact.
Communication-aware nonlinear domain decomposition remains diagnostic until the exact workload has identity, communication, transport-window, and matched profiler evidence for any nonlinear multi-GPU speedup claim. If a future optimization changes that conclusion, refresh the CPU and GPU artifacts before changing README or release-note wording; the boundary is mirrored in Features and Claim Scope.